R語言除了有大量的統計分析套件,在資料視覺化上一定要筆記的就是R Packages下載排行版前幾名的[ggplot2]。
資料庫跑完分析後直接用厲害的視覺化魔法呈現在網站上!
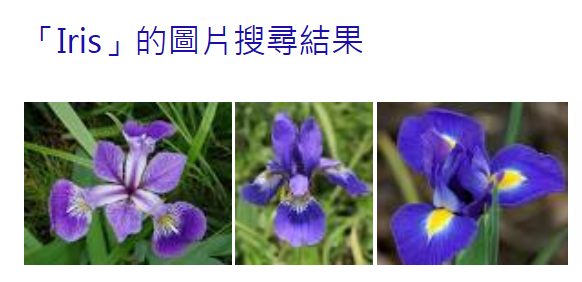
1.測試ggplot2的視覺化,這邊我們用R內建的生物統計資料集:Iris鳶尾花
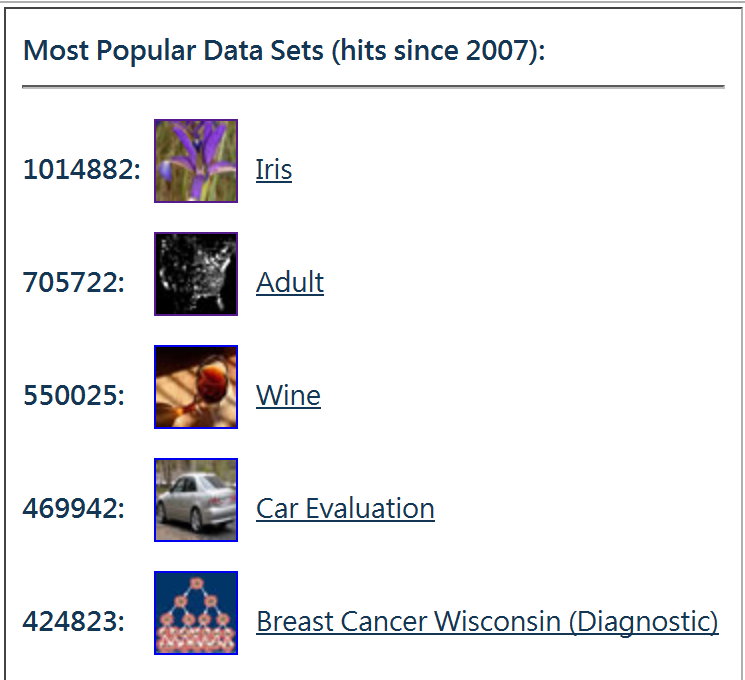
Iris也是Machine Learning Repository最popular的Data Sets
使用內建資料集iris輸出結果集OutputDataSet
Iris鳶尾花資料
execute sp_execute_external_script
  @language = N'R'
, @script = N'
OutputDataSet <- head(iris,5)
'
, @input_data_1 = N''
WITH RESULT SETS (([Sepal_Length] numeric(11,2),
[Sepal_Width] numeric(11,2),
[Petal_Length] numeric(11,2),
[Petal_width] numeric(11,2),
[class] varchar(30)));
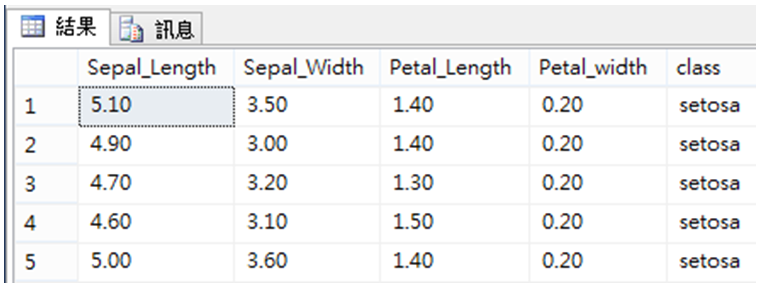
iris資料集有150筆生物樣本觀測值,共有5個資料行,前4個是作為定量分析的特徵,最後1個是亞種:
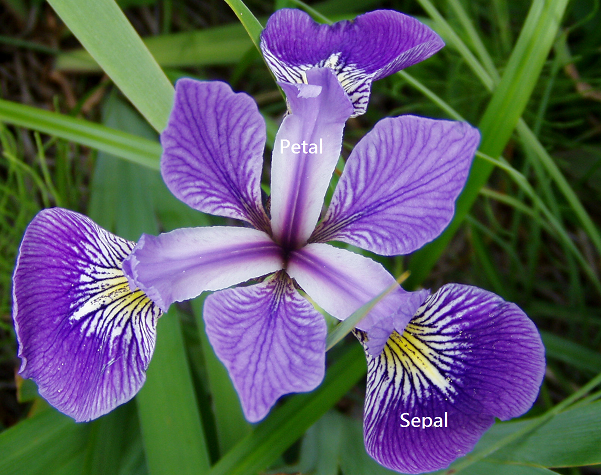
- 特徵1:花萼長度(Sepal.Length)
- 特徵2:花萼寬度(Sepal.Width)
- 特徵3:花瓣長度(Petal.Length)
- 特徵4:花瓣寬度(Petal.Width)
- 亞種(Class)
http://archive.ics.uci.edu/ml/datasets/Iris
2.安裝ggplot2相關套件
可以參考第二篇install.packages('ggplot2',dependencies = TRUE)
相依的套件清單:
c("digest","gtable","plyr","Rcpp","proto","reshape2","stringr","stringi","magrittr","scales","munsell","labeling","colorspace")
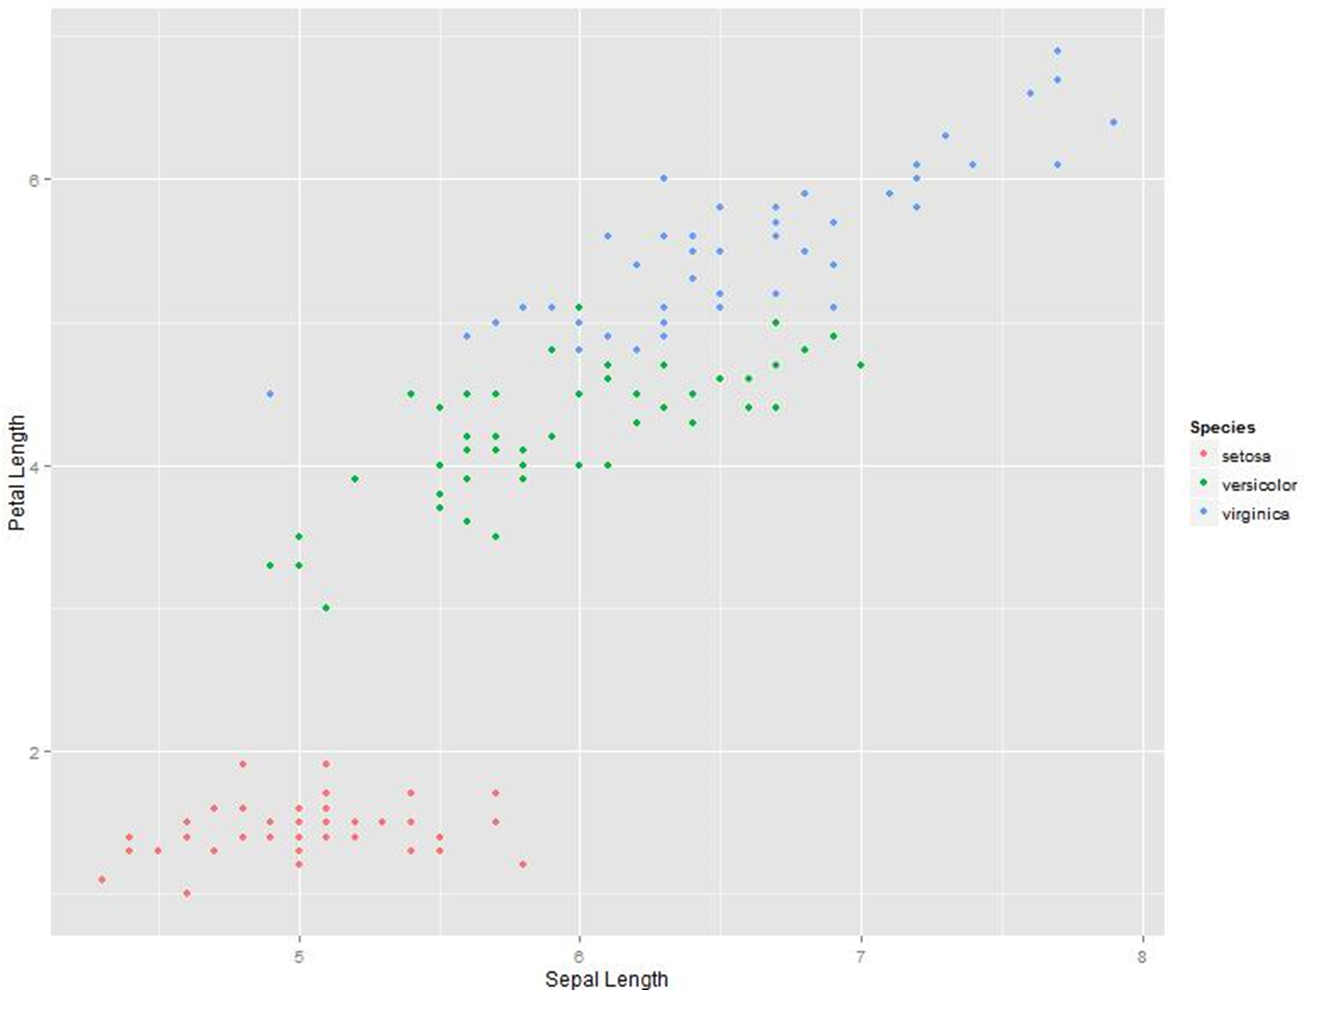
3.查看3個品種花萼(sepal )和花瓣(petal)長度(length)的資料分佈,用視覺化秒懂。
execute sp_execute_external_script
  @language = N'R'
, @script = N'
library("ggplot2");
image_file = tempfile();
jpeg(filename = image_file,width=800,height=600);
print(qplot(Sepal.Length, Petal.Length, data= iris, color= Species,xlab = "Sepal Length",ylab="Petal Length"));
dev.off();
OutputDataSet <- data.frame(data=readBin(file(image_file,"rb"),what=raw(),n=1e6));
'
, @input_data_1 = N''
WITH RESULT SETS ((plot varbinary(max) NOT NULL));
語法解析
- 載入ggplot2
- 新增image file
- 設定圖片檔案大小800 x 600
- 用quick plot劃出x,y軸分佈圖,顏色選Species,data來自內建iris,繪圖中的x.y軸說明
- 關閉繪圖
- 使用readBin把圖檔載入OutputDataSet的欄位中
- 設定回傳的欄位varbinary(max)
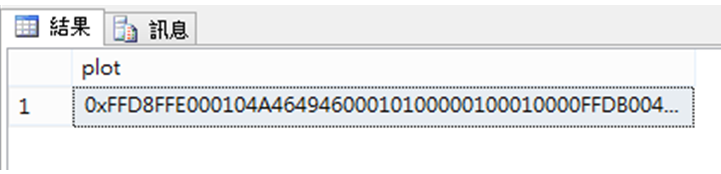
4.我們先用SSMS外掛套件SSMSBoost直接把結果集的Binary資料visualize成圖片。
Binary結果集,右鍵Visualize as > Picture(any format)
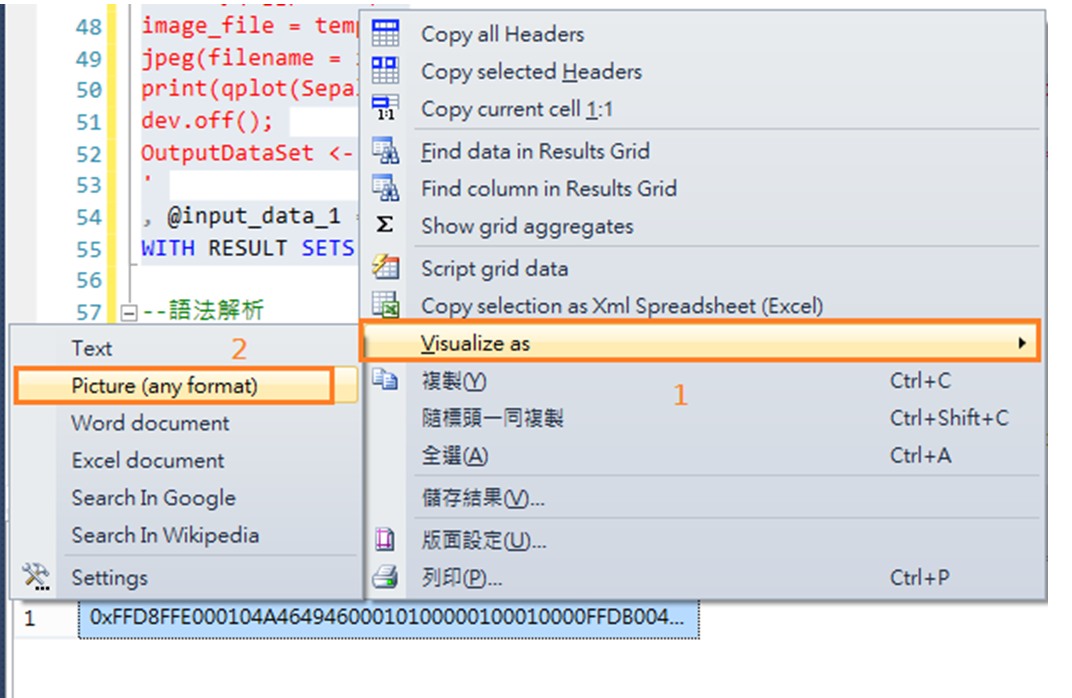
執行後,SSMSBoost程式會自動開啟小畫家顯示:
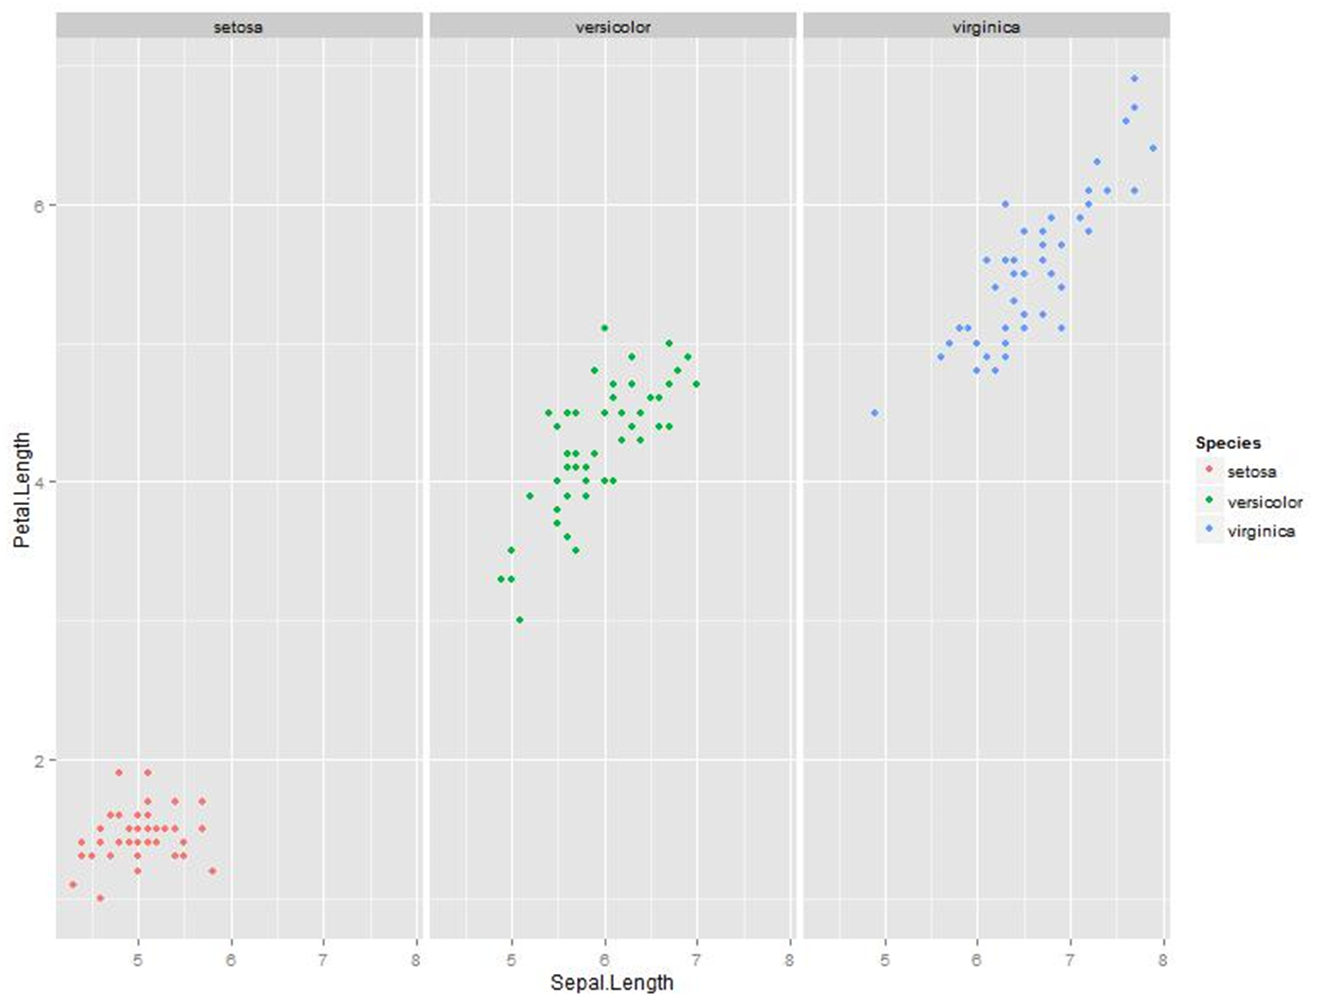
5.除了用亞種分顏色,再增加亞種區塊
execute sp_execute_external_script
  @language = N'R'
, @script = N'
library("ggplot2");
data(iris)
image_file = tempfile();
jpeg(filename = image_file,width=800,height=600);
g <- ggplot(iris, aes(x = Sepal.Length, y = Petal.Length)) + geom_point(aes(color = Species)) + facet_grid(~Species)
print(g);
dev.off();
OutputDataSet <- data.frame(data=readBin(file(image_file,"rb"),what=raw(),n=1e6));
'
, @input_data_1 = N''
WITH RESULT SETS ((plot varbinary(max) NOT NULL));
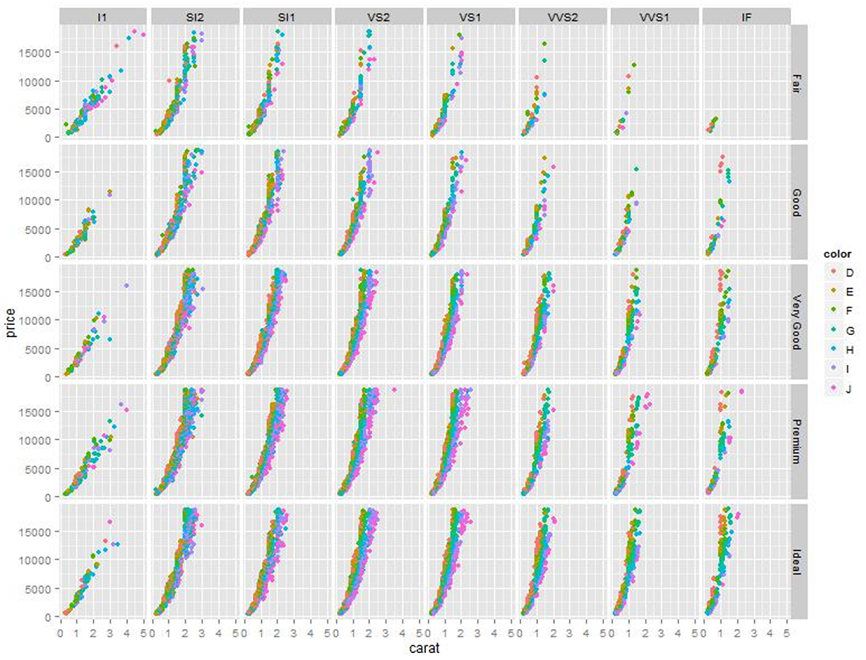
補充:用鑽石資料跑看看
execute sp_execute_external_script
  @language = N'R'
, @script = N'
library("ggplot2");
data(diamonds)
image_file = tempfile();
jpeg(filename = image_file,width=800,height=600);
g <- ggplot(diamonds, aes(x = carat, y = price)) + geom_point(aes(color = color)) + facet_grid(cut ~ clarity)
print(g);
dev.off();
OutputDataSet <- data.frame(data=readBin(file(image_file,"rb"),what=raw(),n=1e6));
'
, @input_data_1 = N''
WITH RESULT SETS ((plot varbinary(max) NOT NULL));
到這邊可以確認R視覺化後的結果,接著的步驟要把圖片回傳給前端AP。
6.建立預存程序usp_ggplot2iris讓前端AP呼叫使用。
create proc usp_ggplot2iris as
execute sp_execute_external_script
  @language = N'R'
, @script = N'
library("ggplot2");
data(iris)
image_file = tempfile();
jpeg(filename = image_file,width=800,height=600);
g <- ggplot(iris, aes(x = Sepal.Length, y = Petal.Length)) + geom_point(aes(color = Species)) + facet_grid(~Species)
print(g);
dev.off();
OutputDataSet <- data.frame(data=readBin(file(image_file,"rb"),what=raw(),n=1e6));
'
, @input_data_1 = N''
WITH RESULT SETS ((plot varbinary(max) NOT NULL));
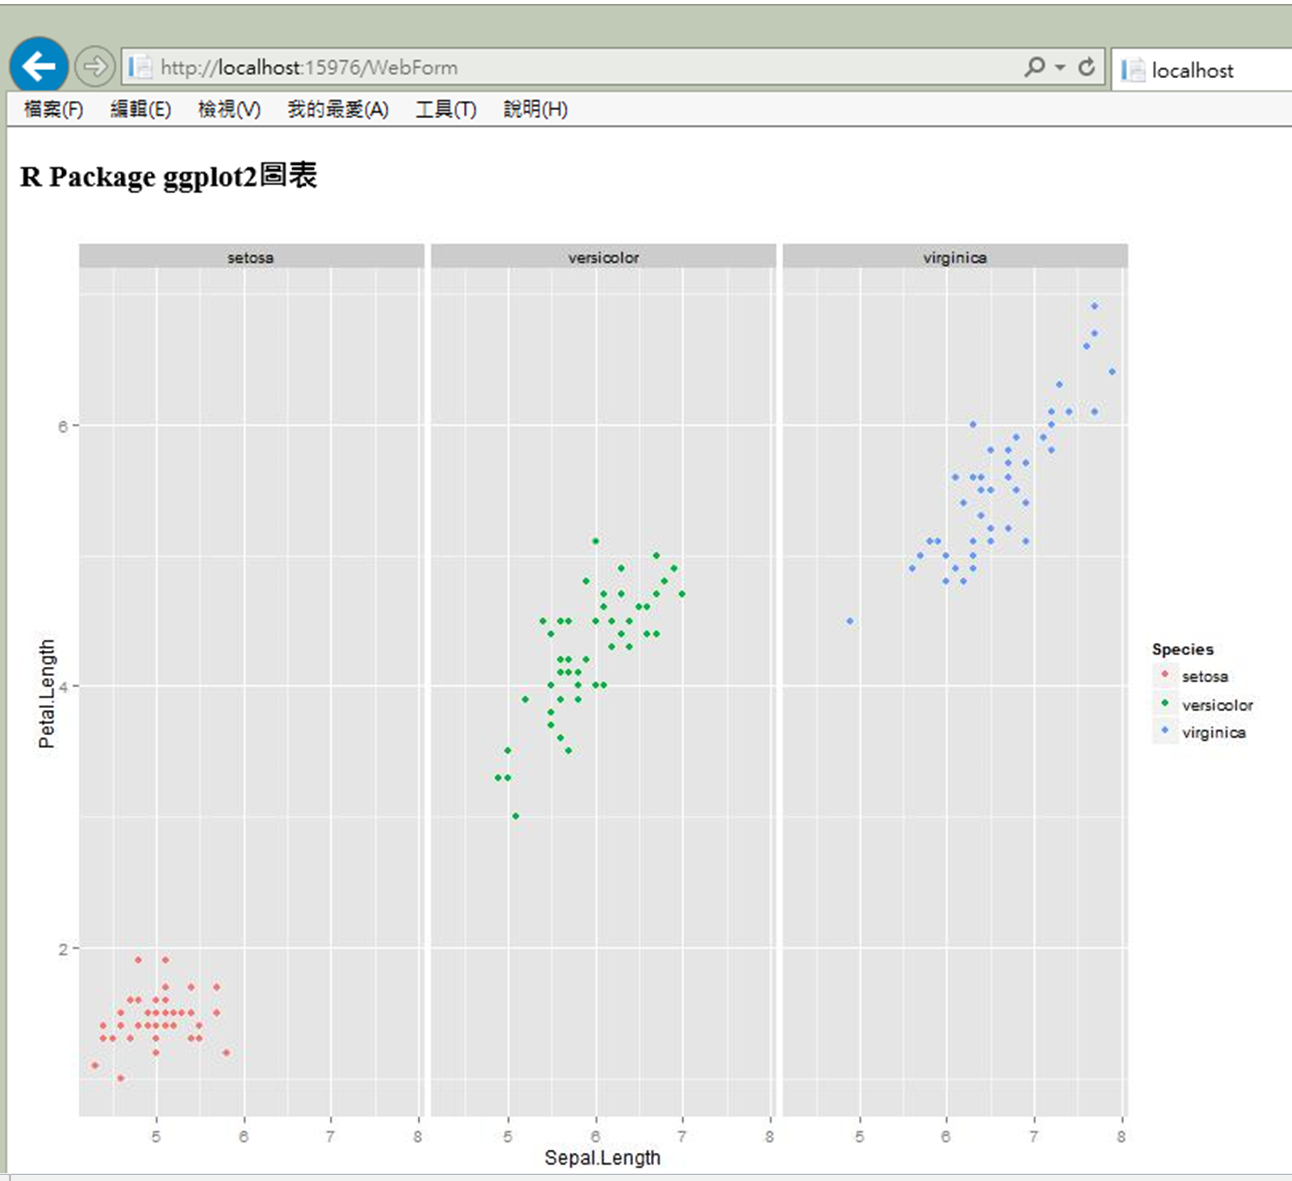
7.網站程式呼叫預存程序取得結果, Web Form範例:
WebForm.aspx 增加一個圖型控制項image1
<%@ Page Language="C#" AutoEventWireup="true" CodeBehind="WebForm.aspx.cs" Inherits="WebApplication1.WebForm" %>
<!DOCTYPE html>
<html xmlns="http://www.w3.org/1999/xhtml">
<head runat="server">
    <meta http-equiv="Content-Type" content="text/html; charset=utf-8" />
    <title></title>
</head>
<body>
    <form id="form1" runat="server">
        <h3>R Package ggplot2圖表</h3>
        <asp:Image ID="Image1" runat="server" Visible="true"/>
    </form>
</body>
</html>
WebForm.aspx.cs程式碼使用SqlDataAdapter取回usp_ggplot2diamonds結果集
protected void Page_Load(object sender, EventArgs e)
{
    using (SqlConnection conn =
        new SqlConnection(@"Data Source=DB1\SQL2016;Initial Catalog=tempdb;User ID=ImDeveloper;Password="))
    {
        conn.Open();
        string mysql = @"usp_ggplot2iris";
        using (SqlCommand cmd = new SqlCommand(mysql, conn))
        {
            cmd.CommandType = CommandType.StoredProcedure;
            DataTable dt = new DataTable();
            using (SqlDataAdapter adp = new SqlDataAdapter(cmd))
            {
                adp.Fill(dt);
            }
            byte[] bytes = (byte[])dt.Rows[0][0];
            string base64String = Convert.ToBase64String(bytes, 0, bytes.Length);
            Image1.ImageUrl = "data:image/png;base64," + base64String;
        }
    }
}
前端網站AP顯示視覺化後的分析結果:
小結
- 希望把ASP.NET 網站提供互動式的方式呈現,就像shiny,未來有機會再繼續強化。
- 可以發現virginica種的鳶尾花在花瓣和花萼的長度最長。
參考:
SSMSBoost
安德森鳶尾花卉數據集