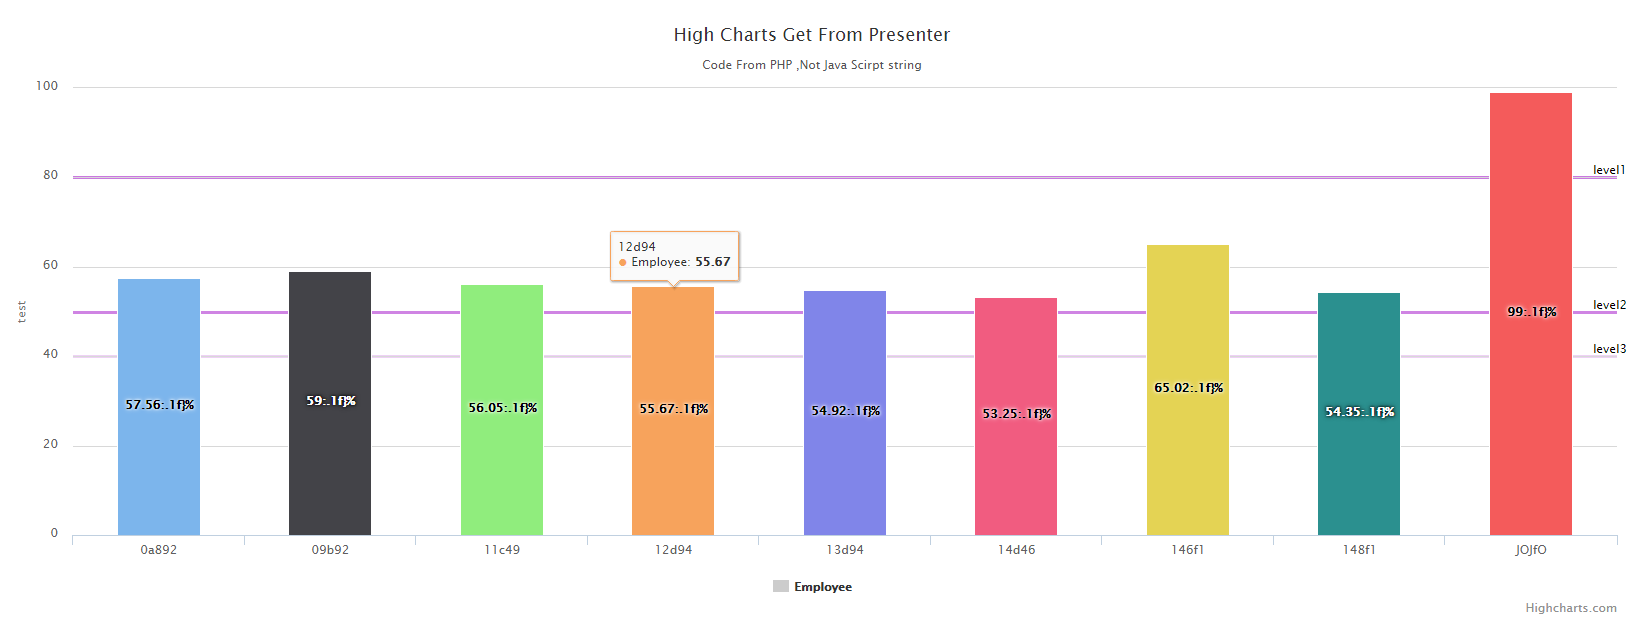
為避免在程式中組Java Script字串,調整做法,改以陣列方式給予Charts所需值
Controller->負責呼叫R取得資料陣列
View->顯示圖形
Presener->接收view傳來資料陣列,處理成Charts所需
測試程式,無商業邏輯,因此無Services程式
Controller程式,取得View所需資料傳回,data為x/y軸所需資料,linearray為畫面所畫三條横線資料(範例寫3,有需要去調整R回傳List,一樣可以自由增減數量),圖形都會依所傳資料繪製,
橫線若有增減,只要針對資料進行增減即可,取決於R所回傳
class HighChartsController extends Controller
{
    protected $localservices;
    protected $logservices;
    protected $localurl;
    protected $localview;

    public function __construct(LocalServices $localservices)
    {
       $this->localservices=$localservices;

       $this->localurl='Charts\HighCharts';
       $this->localview='Charts.HighCharts';
    }

    public function List5(Request $request) {


        exec("Rscript ".resource_path()."\\R\\Test3.R  80 50 40", $response);
        //dd( $response);
        $result=json_decode($response[0]);

        $data = $result[0];

        $linearray=array("level1"=>$result[1],"level2"=>$result[2],"level3"=>$result[3]);

        return view($this->localview.'.List5',compact('data','linearray'));
    }

}
view的部份較單純,因為可能會由url的將況,所以會用stripslashes進行包覆
@extends('layouts.app')
    @section('HitsGlobal')
        @parent

    @endsection

    @section('content')
        @inject('localpresenter','JoContract\Charts\HighCharts\List5Presenter')

      <div id="container" style="width:100%; height:600px;"> </div>

    @stop
    @section('HitsLoadScript')
        @parent
        <script type="text/javascript" src="{{ URL::asset('js/HighCharts/highcharts.js') }}"></script>
        <script type="text/javascript" src="{{ URL::asset('js/HighCharts/exporting.js') }}"></script>
    @endsection
    @section('HitsScript')
        @parent
        $(function () {
            $('#container').highcharts(
                {!! stripslashes(json_encode($localpresenter->getMyCharts($data,$linearray)))  !!}
            );
        })
    @endsection
Presenter部份,只是改把原本用字串組java Scirpt的部份,改用程式化,這樣。。。起碼不用去對字串到底那串錯了,個人覺得,比較好寫
其中畫Line的部份,因為必需手動指定色,在網路上抄了一個取色碼的函數(CreateRndClrStr),一樣放在Laravel所允許的地方當成共用函數
要再想法子調整,因為畫出來色系太相近了。。。。可能同一時間取的亂數都差不多吧。。。。
<?php
namespace JoContract\Charts\HighCharts;
use URL;
class List5Presenter{

    public function getMyCharts($data,$linearray) {


        $myCharts["chart"] = array("type" =>"column");
        $myCharts["title"] = array("text" => "High Charts Get From Presenter");
        $myCharts["subtitle"] = array("text" => "Code From PHP ,Not Java Scirpt string");

        //---------------------------------------------
        //取得XY軸相關資料點
        //---------------------------------------------
        $serries=array();
        foreach($data as $key=>$value)
        {
                //$tmpurl="  click : function(event) { window.location='". URL::asset('Charts/HighCharts/List1/').'/'.$key. " }";
                array_push($serries
                        ,array(
                        "name"=>$key,
                        "y"=>$value,
                        )
                     );
        }

        $myCharts["xAxis"] = array("type" => "category",);

        // --------------------------------------------------------------------
        // 取得Line線資料
        // ----------------------------------------------------------------------

        $linecharts=array();
        $getcolor=true;
        foreach($linearray as $key=>$value) {
                array_push($linecharts,
                        array(
                            "value"=>$value,
                            "color"=>CreateRndClrStr(rand(100,249),!$getcolor),
                            "dashStyle"=>"Sold",
                            "width"=>3,
                            "label"=>array("text"=>$key,"align"=>"right"),
                        )
                );
        }


        $myCharts["yAxis"] = array("title" => array("text" => "test"),"min"=>0,"max"=>100,"plotLines"=>$linecharts);
        $myCharts["plotOptions"] = array("series"=>array(
                                                "borderWidth"=>"1",
                                                "allowPointSelect"=>true,
                                                "dataLabels"=>array("enabled"=>true,"format"=>"{point.y:.1f}%","inside"=>true,)
                                        ),

                        );

        $myCharts["series"] = [
             array(
                 "name"=>"Employee",
                 "colorByPoint"=>true,
                 "data"=>$serries
                 ,
             )
        ];
        return $myCharts;
    }
}
結果和之前一樣,但差在click事件目前還加不上去,仍在測試努力中。。。。
20160525-click改用replace方式已解決

打雜打久了,就變成打雜妹
程式寫久了,就變成老乞丐