[Windows Mobile] Resco MobileForms Toolkit
1. 簡介
在找尋如何畫出統計圖表時,發現 Resco MobileForms Toolkit,但不是免費的,因此下載免費的 Evaluation 版本使用看看。
2. 方法
2.1 下載與安裝 Resco MobileForms Toolkit
首先點選 網址 下載 Resco MobileForms Toolkit 的 Evaluation version
進行安裝
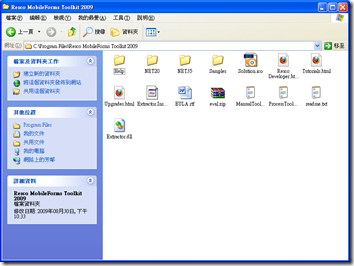
安裝完成後,在安裝目錄下,有 Help 與 Sample 等相關參考資訊可以讓大家了解如何使用 Resco 控制項
2.2 使用 Resco MobileForms Toolkit
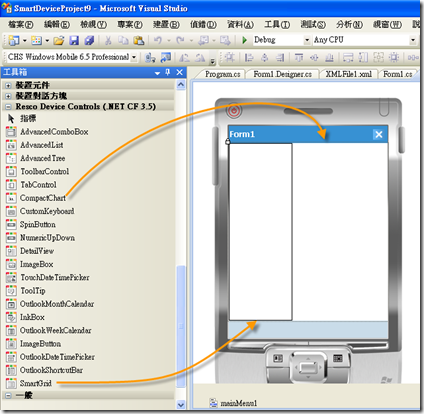
開啟新的專案後,於工具箱中,多出了 Resco Device Controls,也就是 Resco 所提供的控制項,可以藉由拖拉的方式,將控制項加入表單中。
接著就介紹畫圖表功能
2.3 CompactChart 與 SmartGrid 控制項
首先開啟新的智慧型裝置專案,並且將 CompactCheat 與 SmartGrid 加入表單中
並且新增 xml 檔案,放置要顯示的資料
<?xml version="1.0" encoding="utf-8"?>
<Data>
  <Finance>
    <Year>92</Year>
    <Revenue>10</Revenue>
  </Finance>
  <Finance>
    <Year>93</Year>
    <Revenue>15</Revenue>
  </Finance>
  <Finance>
    <Year>94</Year>
    <Revenue>8</Revenue>
  </Finance>
  <Finance>
    <Year>95</Year>
    <Revenue>16</Revenue>
  </Finance>
  <Finance>
    <Year>96</Year>
    <Revenue>9</Revenue>
  </Finance>
  <Finance>
    <Year>97</Year>
    <Revenue>20</Revenue>
  </Finance>
  <Finance>
    <Year>98</Year>
    <Revenue>7</Revenue>
  </Finance>
</Data>
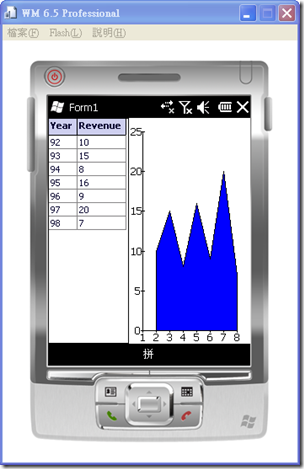
撰寫以下程式碼,將 xml 資料顯示在 SmartGrid 中,並且繪製成 Area 圖於 CompactChart 中
using System;
using System.Linq;
using System.Collections.Generic;
using System.ComponentModel;
using System.Data;
using System.Drawing;
using System.Text;
using System.Windows.Forms;

namespace SmartDeviceProject9
{
    public partial class Form1 : Form
    {
        public Form1()
        {
            InitializeComponent();

            Resco.Controls.SmartGrid.SmartGrid.AutoColumns = true;  // 設定 SmartGrid 為 AutoColumns
            Resco.Controls.SmartGrid.SmartGrid.AutoColumnWidth = true;  // 設定 SmartGrid 為 AutoColumnWidth
        }

        private void Form1_Load(object sender, EventArgs e)
        {
            DataSet ds = new DataSet();  // 初始化 DataSet 類別變數 ds
            ds.ReadXml(@"\Program Files\SmartDeviceProject9\XMLFile1.xml");  // 將 XML 檔讀入 ds 中

            this.smartGrid1.DataSource = ds.Tables[0];  // 設定 smartGrid1 的資料來源為 ds.Tables[0]
            this.compactChart1.DataSource = ds.Tables[0];  // 設定 compactChart1 的資料來源為 ds.Tables[0]

            //create series
            this.compactChart1.ChartType = Resco.Controls.CompactChart.ChartType.Area;  // 設定顯示圖表為 Area
            this.compactChart1.Series.Add(new Resco.Controls.CompactChart.SeriesByColumn(Color.Blue, "Revenue", "Revenue")); // 設定 Color:藍色, name: Revenue, Column Name: Revenue
            this.compactChart1.BarChart.XSeriesName = "Revenue";  // 設定 Series Name 為 Revenue
        }

    }
}
執行結果
2.4 其他控制項
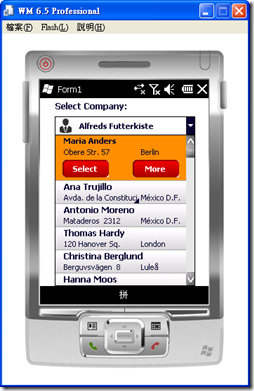
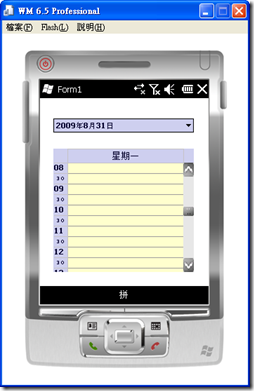
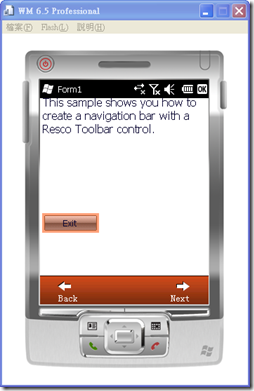
Resco 提供的控制項其實蠻多的,等待大家去使用,以下列出一些 Demo 畫面供大家參考
(1) AdvancedComboBox
(2) OutlookDateTimePicker 與 OutlookWeekCalendar
(3) ToolBar
3. 參考


