於專案中使用install.package來安裝ggplot2,並將套件載入,使用R語言內建的iris(鳶尾花資料集)進行皮爾森積差相關分析並產生散佈圖。
相關分析解讀要點:
- 相關係數介於-1(負相關)至1(正相關)之間
- 相關係數沒有單位
- 兩數列有相關,並不表示有因果關係
- 從ggplot2產生的散佈圖中,兩數列若呈現線性關係,則表示有相關聯性
cor方法其他參數可參考:https://www.rdocumentation.org/packages/stats/versions/3.5.1/topics/cor
# 參考來源:https://rpubs.com/skydome20/R-Note5-First_Practice
# install.packages(
#    "ggplot2",
#    repos = c("http://rstudio.org/_packages",
#    "http://cran.rstudio.com")
# )

#install.packages("Rtools",repos = "https://cran.r-project.org/bin/windows/Rtools/")
library("ggplot2")

#iris資料集說明:R語言內建的鳶尾花資料(from datasets)
#Sepal.Length:花萼長度(cm)
#Sepal.Width:花萼寬度(cm)
#Petal.Length:花瓣長度(cm)
#Petal.Width:花瓣寬度(cm)
#Species:Setosa,Versicolor,Virginica(3種)

typeof(iris)
names(iris)   #列出所有資料欄位
cor1 <- cor(iris$Sepal.Length,iris$Sepal.Width)   #兩數列求相關係數
finalRow <- lapply(iris, "[[", length(iris)) #篩選iris列表中索引值最高的資料
head(iris , n=10)  #列出整個list太多,所以只列出iris列表中的前10筆
summary(iris) #基本統計分析
iris[0] #顯示資訊
iris[-5] #去掉第5行(直)
cor(iris[-5])  #去掉第5行,將剩餘的數列做相關分析,求相關係數
irisfilter <- iris[-3][-3][-3]  #去掉第3 4 5行 ,使用List型態,則內容為動態,第3行 刪掉, 第4行、第5行會往前遞補
head(irisfilter , n=10)  #列出整個list太多,所以只列出iris列表中的前10筆
irisfilter$Sepal.Length #欄位內容顯示(以陣列方式讀出)
irisfilter$Sepal.Width #欄位內容顯示(以陣列方式讀出)
cor2 <- cor(irisfilter$Sepal.Length , irisfilter$Sepal.Width)  #兩數列求相關係數
cor2
all.equal(cor1 , cor2) #比較兩個相關係數是否相等
pairs(irisfilter)  # 相關分析繪圖
pairs(iris[-5])   # 相關分析繪圖
執行結果如下:
> typeof(iris)
[1] "list"
> names(iris)   #列出所有資料欄位
[1] "Sepal.Length" "Sepal.Width"  "Petal.Length" "Petal.Width"  "Species"
> cor1 <- cor(iris$Sepal.Length,iris$Sepal.Width)   #兩數列求相關係數
> finalRow <- lapply(iris, "[[", length(iris)) #篩選iris列表中索引值最高的資料
> head(iris , n=10)  #列出整個list太多,所以只列出iris列表中的前10筆
   Sepal.Length Sepal.Width Petal.Length Petal.Width Species
1           5.1         3.5          1.4         0.2  setosa
2           4.9         3.0          1.4         0.2  setosa
3           4.7         3.2          1.3         0.2  setosa
4           4.6         3.1          1.5         0.2  setosa
5           5.0         3.6          1.4         0.2  setosa
6           5.4         3.9          1.7         0.4  setosa
7           4.6         3.4          1.4         0.3  setosa
8           5.0         3.4          1.5         0.2  setosa
9           4.4         2.9          1.4         0.2  setosa
10          4.9         3.1          1.5         0.1  setosa
> summary(iris) #基本統計分析
  Sepal.Length    Sepal.Width     Petal.Length    Petal.Width
 Min.   :4.300   Min.   :2.000   Min.   :1.000   Min.   :0.100
 1st Qu.:5.100   1st Qu.:2.800   1st Qu.:1.600   1st Qu.:0.300
 Median :5.800   Median :3.000   Median :4.350   Median :1.300
 Mean   :5.843   Mean   :3.057   Mean   :3.758   Mean   :1.199
 3rd Qu.:6.400   3rd Qu.:3.300   3rd Qu.:5.100   3rd Qu.:1.800
 Max.   :7.900   Max.   :4.400   Max.   :6.900   Max.   :2.500
       Species
 setosa    :50
 versicolor:50
 virginica :50


> iris[0] #顯示資訊
data frame with 0 columns and 150 rows
> head(iris[-5], n=10) #去掉第5行(直)
   Sepal.Length Sepal.Width Petal.Length Petal.Width
1           5.1         3.5          1.4         0.2
2           4.9         3.0          1.4         0.2
3           4.7         3.2          1.3         0.2
4           4.6         3.1          1.5         0.2
5           5.0         3.6          1.4         0.2
6           5.4         3.9          1.7         0.4
7           4.6         3.4          1.4         0.3
8           5.0         3.4          1.5         0.2
9           4.4         2.9          1.4         0.2
10          4.9         3.1          1.5         0.1
> cor(iris[-5])  #去掉第5行,將剩餘的數列做相關分析,求相關係數
             Sepal.Length Sepal.Width Petal.Length Petal.Width
Sepal.Length    1.0000000  -0.1175698    0.8717538   0.8179411
Sepal.Width    -0.1175698   1.0000000   -0.4284401  -0.3661259
Petal.Length    0.8717538  -0.4284401    1.0000000   0.9628654
Petal.Width     0.8179411  -0.3661259    0.9628654   1.0000000
> irisfilter <- iris[-3][-3][-3]  #去掉第3 4 5行 ,使用List型態,則內容為動態,第3行 刪掉, 第4行、第5行會往前遞補
> head(irisfilter , n=10)  #列出整個list太多,所以只列出iris列表中的前10筆
   Sepal.Length Sepal.Width
1           5.1         3.5
2           4.9         3.0
3           4.7         3.2
4           4.6         3.1
5           5.0         3.6
6           5.4         3.9
7           4.6         3.4
8           5.0         3.4
9           4.4         2.9
10          4.9         3.1
> irisfilter$Sepal.Length #欄位內容顯示(以陣列方式讀出)
  [1] 5.1 4.9 4.7 4.6 5.0 5.4 4.6 5.0 4.4 4.9 5.4 4.8 4.8 4.3 5.8 5.7 5.4 5.1
 [19] 5.7 5.1 5.4 5.1 4.6 5.1 4.8 5.0 5.0 5.2 5.2 4.7 4.8 5.4 5.2 5.5 4.9 5.0
 [37] 5.5 4.9 4.4 5.1 5.0 4.5 4.4 5.0 5.1 4.8 5.1 4.6 5.3 5.0 7.0 6.4 6.9 5.5
 [55] 6.5 5.7 6.3 4.9 6.6 5.2 5.0 5.9 6.0 6.1 5.6 6.7 5.6 5.8 6.2 5.6 5.9 6.1
 [73] 6.3 6.1 6.4 6.6 6.8 6.7 6.0 5.7 5.5 5.5 5.8 6.0 5.4 6.0 6.7 6.3 5.6 5.5
 [91] 5.5 6.1 5.8 5.0 5.6 5.7 5.7 6.2 5.1 5.7 6.3 5.8 7.1 6.3 6.5 7.6 4.9 7.3
[109] 6.7 7.2 6.5 6.4 6.8 5.7 5.8 6.4 6.5 7.7 7.7 6.0 6.9 5.6 7.7 6.3 6.7 7.2
[127] 6.2 6.1 6.4 7.2 7.4 7.9 6.4 6.3 6.1 7.7 6.3 6.4 6.0 6.9 6.7 6.9 5.8 6.8
[145] 6.7 6.7 6.3 6.5 6.2 5.9
> irisfilter$Sepal.Width #欄位內容顯示(以陣列方式讀出)
  [1] 3.5 3.0 3.2 3.1 3.6 3.9 3.4 3.4 2.9 3.1 3.7 3.4 3.0 3.0 4.0 4.4 3.9 3.5
 [19] 3.8 3.8 3.4 3.7 3.6 3.3 3.4 3.0 3.4 3.5 3.4 3.2 3.1 3.4 4.1 4.2 3.1 3.2
 [37] 3.5 3.6 3.0 3.4 3.5 2.3 3.2 3.5 3.8 3.0 3.8 3.2 3.7 3.3 3.2 3.2 3.1 2.3
 [55] 2.8 2.8 3.3 2.4 2.9 2.7 2.0 3.0 2.2 2.9 2.9 3.1 3.0 2.7 2.2 2.5 3.2 2.8
 [73] 2.5 2.8 2.9 3.0 2.8 3.0 2.9 2.6 2.4 2.4 2.7 2.7 3.0 3.4 3.1 2.3 3.0 2.5
 [91] 2.6 3.0 2.6 2.3 2.7 3.0 2.9 2.9 2.5 2.8 3.3 2.7 3.0 2.9 3.0 3.0 2.5 2.9
[109] 2.5 3.6 3.2 2.7 3.0 2.5 2.8 3.2 3.0 3.8 2.6 2.2 3.2 2.8 2.8 2.7 3.3 3.2
[127] 2.8 3.0 2.8 3.0 2.8 3.8 2.8 2.8 2.6 3.0 3.4 3.1 3.0 3.1 3.1 3.1 2.7 3.2
[145] 3.3 3.0 2.5 3.0 3.4 3.0
> cor2 <- cor(irisfilter$Sepal.Length , irisfilter$Sepal.Width)  #兩數列求相關係數
> cor2
[1] -0.1175698
> all.equal(cor1 , cor2) #比較兩個相關係數是否相等
[1] TRUE
pairs(irisfilter)產生的散佈圖如下,散佈圖的解釋可對照cor(iris[-3][-3][-3])的執行結果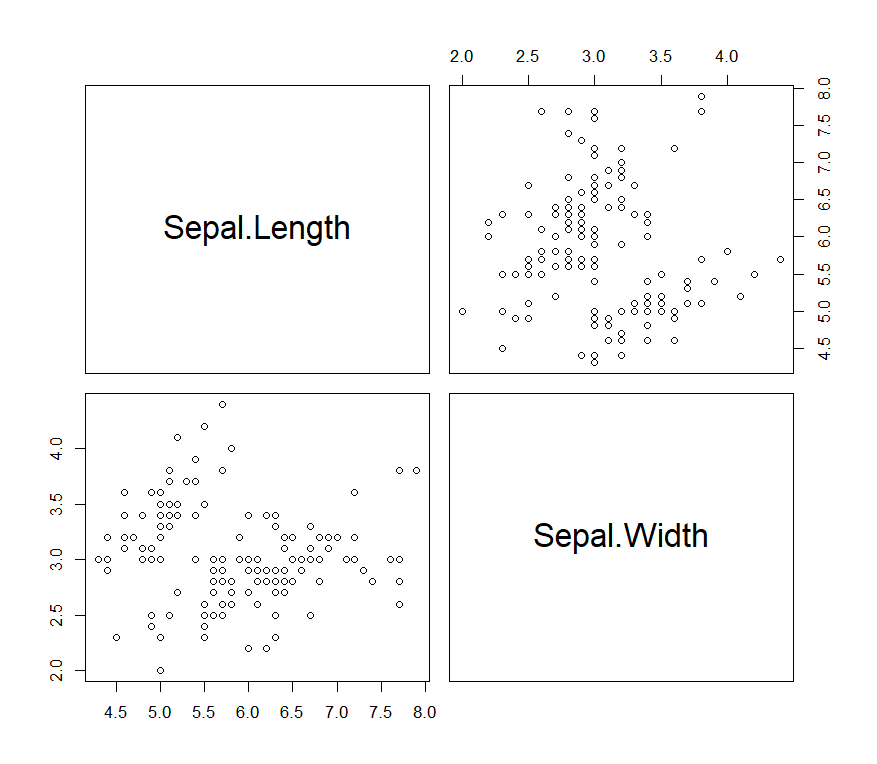
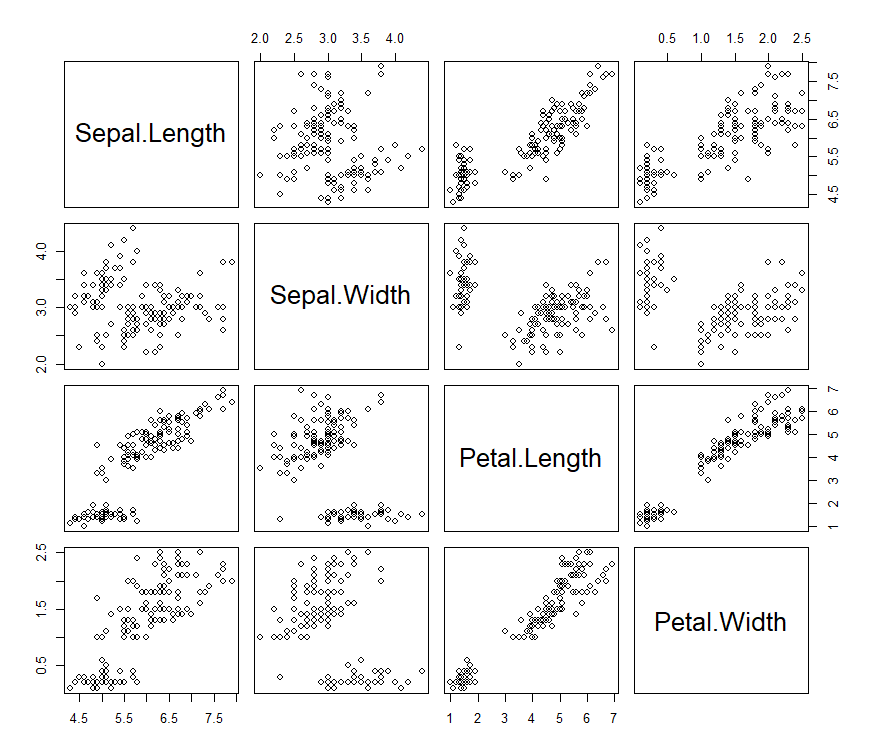
pairs(iris[-5])產生的散佈圖如下,散佈圖的解釋可對照cor(iris[-5])的執行結果