Folium、Python、HeatMapWithTime、MarkerCluster。
Reference:https://github.com/python-visualization/folium/issues/1062、https://blog.yeshuanova.com/2017/10/python-visulization-folium/
Folium通常被用來實現資料視覺化,最近剛好在執行一些大數據視覺化的專案有用到,藉這機會將幾個比較難實現與稀有的作法記錄下來。
會特別紀錄這個是因為這項顯示方式需要額外實現一些code才有辦法達成。
以下將會從資料引入→簡單熱點圖→時序熱點圖→多時序熱點圖共用同一個時間控制軸逐一呈現+markerCluster打點Aggregate呈現。
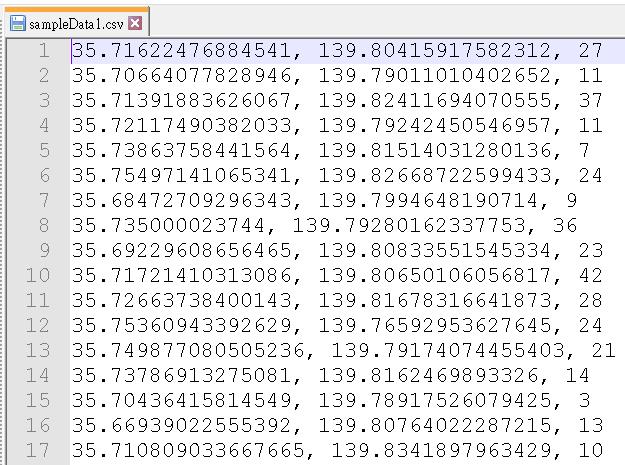
我們先將實驗的資料引入並轉成list,資料內容長這樣:
import folium
from folium.plugins import HeatMap
from folium.plugins import HeatMapWithTime
import pandas as pd
import numpy as np

fileName01 = "heatMapWithTimePlus//sampleData1.csv"
fileName02 = "heatMapWithTimePlus//sampleData2.csv"
fileName03 = "heatMapWithTimePlus//sampleData3.csv"
fileName04 = "heatMapWithTimePlus//sampleData4.csv"
fileName05 = "heatMapWithTimePlus//sampleData5.csv"
fileName06 = "heatMapWithTimePlus//sampleData6.csv"
df01 = pd.read_csv(fileName01, delimiter=",", header = None)
df02 = pd.read_csv(fileName02, delimiter=",", header = None)
df03 = pd.read_csv(fileName03, delimiter=",", header = None)
df04 = pd.read_csv(fileName04, delimiter=",", header = None)
df05 = pd.read_csv(fileName05, delimiter=",", header = None)
df06 = pd.read_csv(fileName06, delimiter=",", header = None)
heatData01 = df01.values.tolist()
heatData02 = df02.values.tolist()
heatData03 = df03.values.tolist()
heatData04 = df04.values.tolist()
heatData05 = df05.values.tolist()
heatData06 = df06.values.tolist()
引入後,就可以拿一個檔案當作熱點圖先打出來看看,結果如下:
fmap = folium.Map(location=[23.712326, 120.804037], zoom_start=12, control_scale=True)
fmap.add_child(HeatMap(data=heatData01))
fmap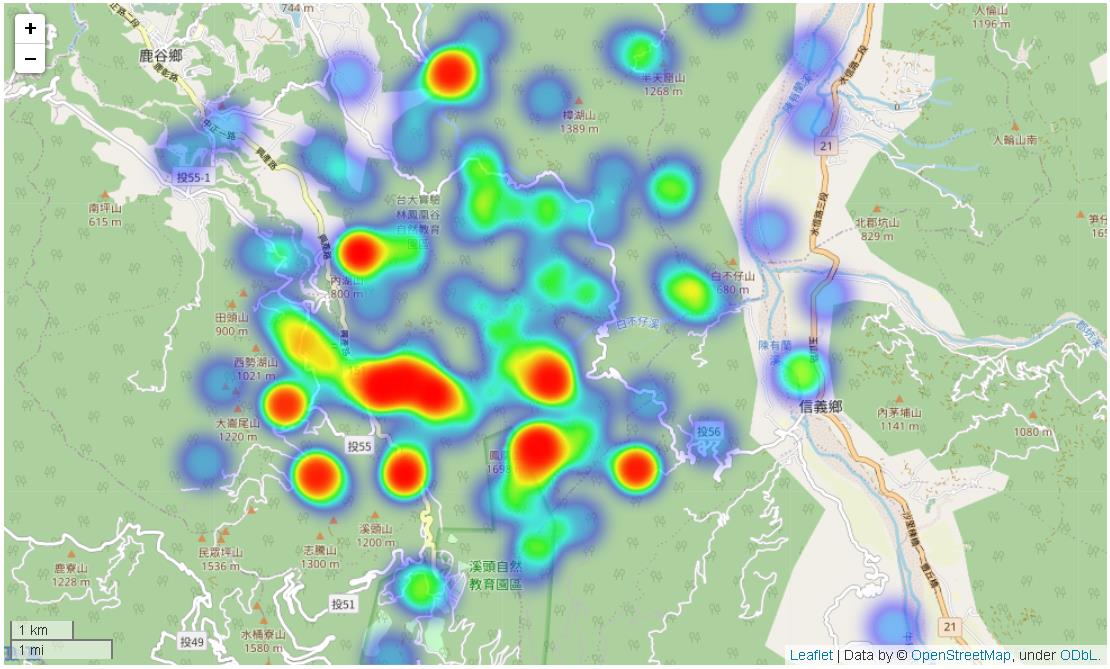
接著我們拿heatData01~heatData03的資料分別代表06:00、08:00、10:00的資料,產生時序熱點圖,結果如下:
Heat_data = []
filterCount = 1 #過濾條件
#Heat_data.append(df01[df01.iloc[:, 2]>filterCount].values.tolist()) #過濾資料用
Heat_data.append(df01.values.tolist())
Heat_data.append(df02.values.tolist())
Heat_data.append(df03.values.tolist())

heatMapWithTimeIndex = ['06:00','08:00','10:00']

fmap = folium.Map(location=[23.712326, 120.804037], zoom_start=12, control_scale=True)
fmap.add_child(HeatMapWithTime(Heat_data,radius=30,index=heatMapWithTimeIndex)) # 顯示連續熱度圖
fmap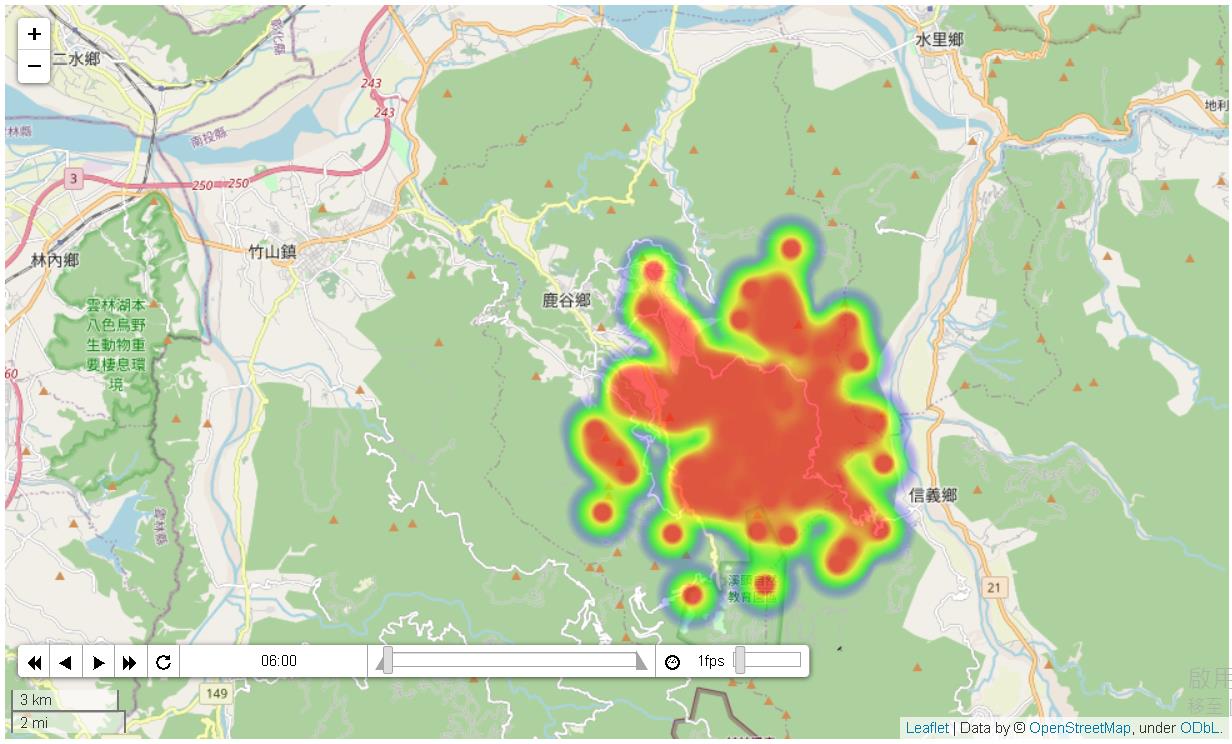
接著就是很多人也在詢問的,多張時序熱點圖打在同一張地圖上,但如果沒客製化會發生什麼事情?就像下面這樣,會多一個控制軸:
Heat_data = []
Heat_data2 = []
filterCount = 1 #過濾條件
#Heat_data.append(df01[df01.iloc[:, 2]>filterCount].values.tolist()) #過濾資料用
Heat_data.append(df01.values.tolist())
Heat_data.append(df02.values.tolist())
Heat_data.append(df03.values.tolist())
Heat_data2.append(df04.values.tolist())
Heat_data2.append(df05.values.tolist())
Heat_data2.append(df06.values.tolist())

heatMapWithTimeIndex = ['06:00','08:00','10:00']

fmap = folium.Map(location=[23.712326, 120.804037], zoom_start=12, control_scale=True)
fmap.add_child(HeatMapWithTime(Heat_data,radius=30,index=heatMapWithTimeIndex)) # 顯示連續熱度圖
fmap.add_child(HeatMapWithTime(Heat_data2,radius=30,index=heatMapWithTimeIndex)) # 顯示連續熱度圖
fmap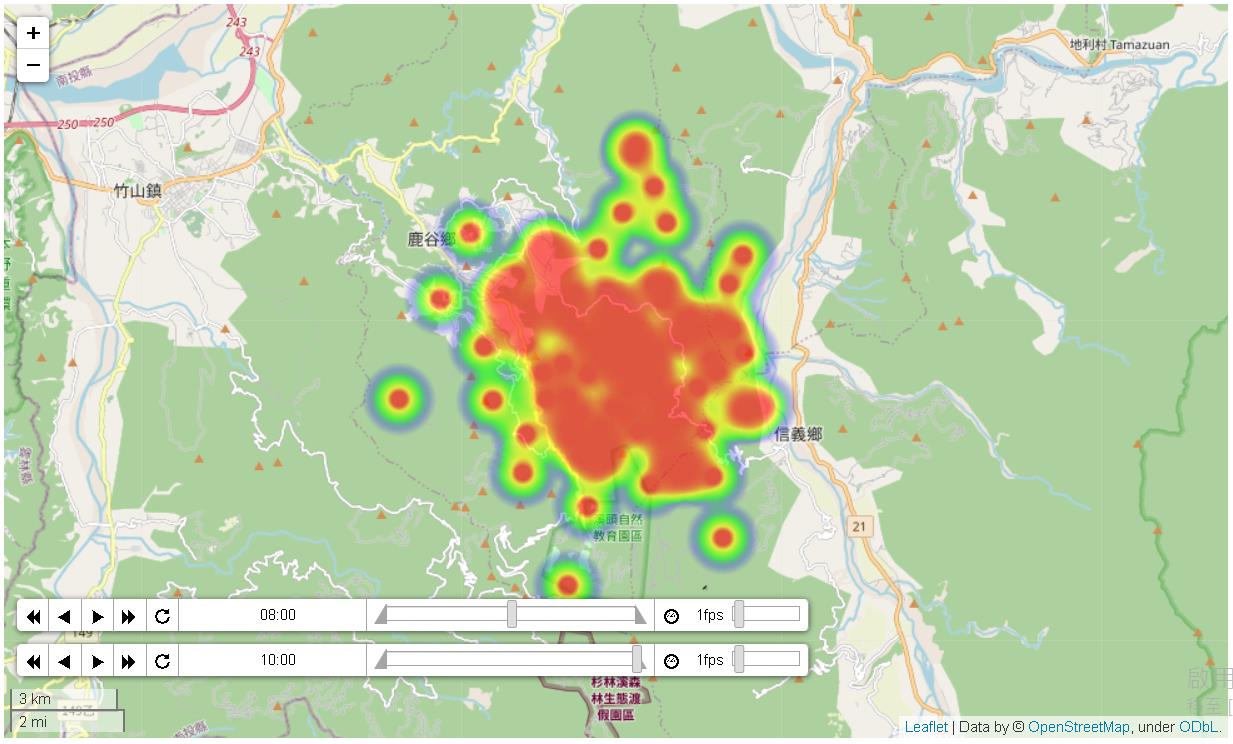
但我們只需要一個控制軸,並搭配想要的時序熱點圖做切換控制,此時必須額外刻一個template去處理,將第一個heatmap之後的內容使用這個template加入。
#https://github.com/python-visualization/folium/issues/1062
#heatMapWithTime打在同一個圖層上使用同一個scroll bar

from jinja2 import Template
from folium.map import Layer
class HeatMapWithTimeAdditional(Layer):
    _template = Template("""
        {% macro script(this, kwargs) %}
            var {{this.get_name()}} = new TDHeatmap({{ this.data }},
                {heatmapOptions: {
                    radius: {{this.radius}},
                    minOpacity: {{this.min_opacity}},
                    maxOpacity: {{this.max_opacity}},
                    scaleRadius: {{this.scale_radius}},
                    useLocalExtrema: {{this.use_local_extrema}},
                    defaultWeight: 1,
                    {% if this.gradient %}gradient: {{ this.gradient }}{% endif %}
                }
            }).addTo({{ this._parent.get_name() }});
        {% endmacro %}
    """)

    def __init__(self, data, name, radius=15,
                 min_opacity=0, max_opacity=0.6,
                 scale_radius=False, gradient=None, use_local_extrema=False,
                 overlay=True, control=True, show=True):
        super(HeatMapWithTimeAdditional, self).__init__(
            name=name, overlay=overlay, control=control, show=show
        )
        self._name = name
        self.data = data

        # Heatmap settings.
        self.radius = radius
        self.min_opacity = min_opacity
        self.max_opacity = max_opacity
        self.scale_radius = 'true' if scale_radius else 'false'
        self.use_local_extrema = 'true' if use_local_extrema else 'false'
        self.gradient = gradient
接著我們將兩個時序熱點圖加入,同時加入一個markerCluster到地圖上顯示(目的是一併呈現Folium將點自動aggregate顯示的功能),markFlag.csv使用的內容格式同sampleData系列。
markerGroup = folium.FeatureGroup(control=True, show=False)
markerCluster = folium.plugins.MarkerCluster(name='markFlag', show=False).add_to(markerGroup)

#加入markFlag
markFlag = "heatMapWithTimePlus//markFlag.csv"
with open(markFlag, encoding="utf-8") as fr:
    for line in fr:
        each = line[:-1].split(',')

        lat    = each[0]
        lng    = each[1]
        number = each[2]
        div = folium.plugins.BeautifyIcon(
                             icon="arrow-down",
                             icon_shape="marker",
                             number=str(number), #顯示檔案第三欄的數字
                             text_color="black",
                             background_color="white"
        )
        folium.Marker(location=[lat,lng],icon=div).add_to(markerCluster)

fmap = folium.Map(location=[23.712326, 120.804037], zoom_start=12, control_scale=True)
fmap.add_child(HeatMapWithTime(Heat_data,radius=30,index=heatMapWithTimeIndex,name='時序熱點圖1', show=False)) # 顯示連續熱度圖
#第二個heatmapwithtime要用hack的方式
HeatMapWithTimeAdditional(Heat_data2, name='時序熱點圖2', show=False).add_to(fmap)
fmap.add_child(markerCluster)
folium.LayerControl(collapsed=False).add_to(fmap)

fmap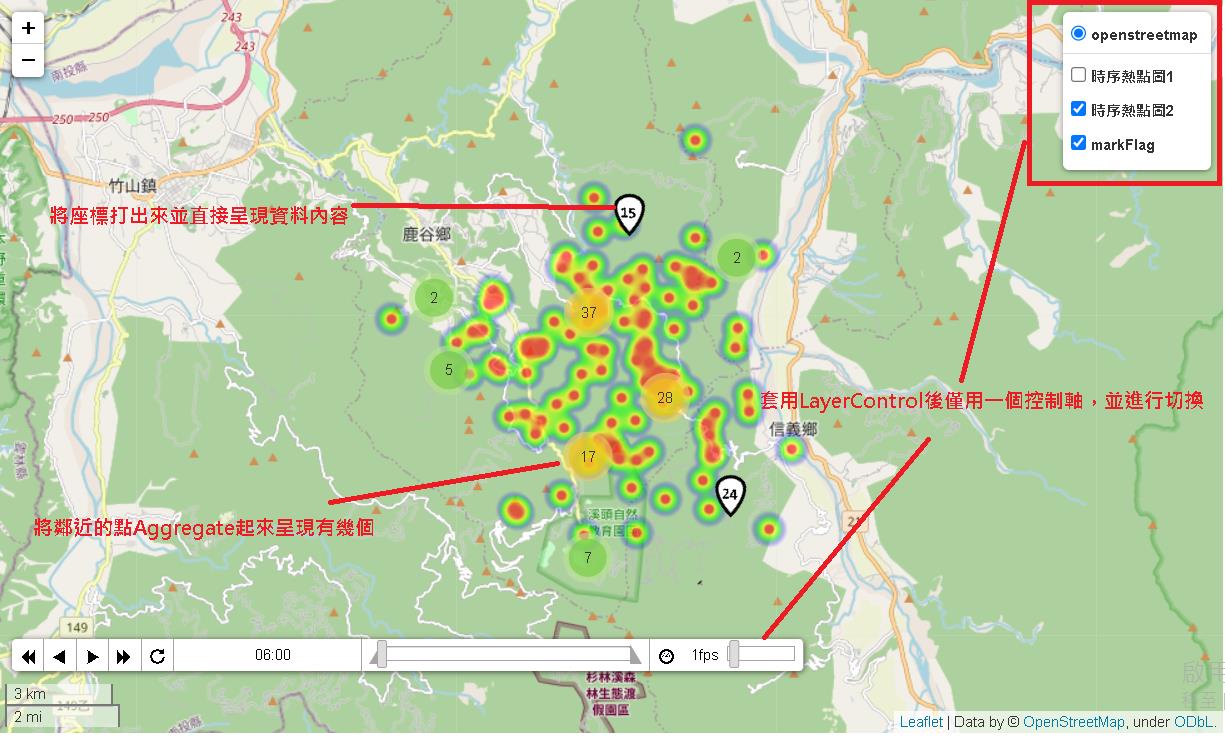
這樣就完成了。