因為最近有需求做一些圖表,在研究Chart 這元件
網路上很多人有教學,官方教學也很多,也有許多範本可以參考
我從 Samples Environments for Microsoft Chart Controls
擷取下面的圖片,方便讓用戶(客戶)了解,圖表能做到哪些樣式
有需要程式碼或是範例請自行去 Samples Environments for Microsoft Chart Controls 下載
我只是整理圖片出來,方便觀看而已
簡單將範例的圖集拉出,還有許多範例功能,請自行下載查看
橫條圖 長條圖 Bar and Column Chart
2D Column Chart | 2D Bar Chart |
3D Column Chart | 3D Stacked Bar Chart |
3D Bar Chart | 3D Column Chart |
線圖 Line Chart
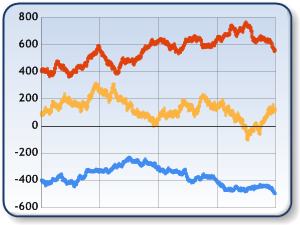
2D Fast Line Chart | 2D Line Chart |
2D Line Chart with Point Markers | 2D Spline Chart |
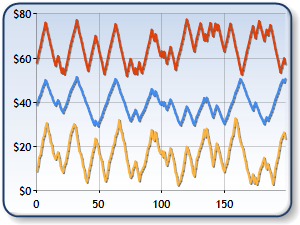
2D Step Line Chart | 3D Spline Chart |
區域圖 Area Chart
2D 100% Stacked Area Chart | 2D Area Chart |
|
2D Stacked Area |
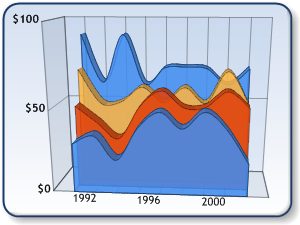
3D Area Chart | 3D Spline Area |
圓餅圖 甜甜圈圖 Pie and Doughnut Chart
2D Stacked Pie Chart | 2D Doughnut Chart |
2D Grouped Pie Chart | 2D Pie Chart with Supplemental Pie Chart |
3D Pie Chart | 3D Pie Chart with Exploded Slice |
3D Stacked Pie Chart | 3D Stair-Stacked Pie |
點狀圖 泡式圖 Point and Bubble Chart
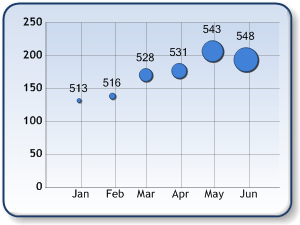
2D Bubble Chart | 2D Point Chart |
2D Point Chart with Custom Point Images | 2D Point Chart with Labels |
2D Point Chart with Different Shaped Markers | 3D Bubble Chart |
FastPoint Chart |
Range Chart
2D Range Chart | 2D Range Bar Chart |
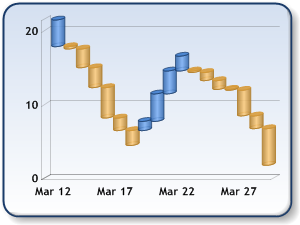
2D Range Column Chart | 2D Spline Range Chart |
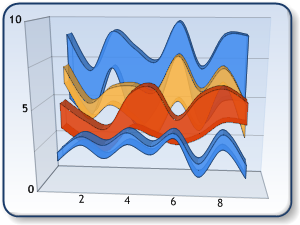
3D Range Chart | 3D Spline Range Chart |
圓形圖 Circular Chart
2D Polar Line Chart | 2D Radar Marker Chart |
2D Radar Area Chart | 3D Polar Line Chart |
3D Radar Area Chart with Custom Labels |
Accumulation Chart
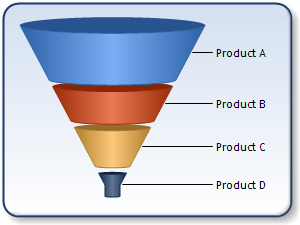
2D Pyramid Chart | 3D Funnel Chart |
3D Funnel Chart with Point Gaps | 3D Width Funnel Chart |
3D Pyramid Chart | 3D Pyramid Chart with Point Gaps |
Price Change Financial Chart
2D Kagi Chart | 2D Point and Figure Chart |
2D Renko Chart | 2D Three Line Break Chart |
3D Three Line Break Chart |
Advanced Financial Chart
Using Bollinger Bands and Moving Averages | Using Bollinger Bands and Volume Indicators |
Candlestick Chart | Calculating Averages and Using Forecasting |
Multiple Price Indicators | Stock Chart |
Combining Chart Types
Column and Area Chart |
|
Pareto Chart | Financial Analysis Chart |